..:: Daily / Monthly Weather History From This Station ::..
Daily Report for the month of April 2024
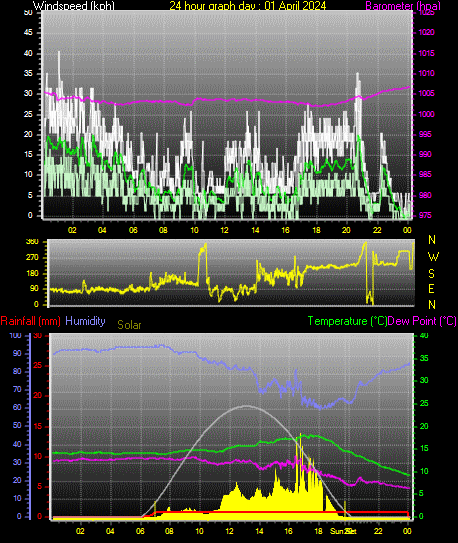
| 1 April Average and Extremes | |
| Average temperature | 14.6°C |
| Average humidity | 82% |
| Average dewpoint | 11.5°C |
| Average barometer | 1003.6 hPa |
| Average windspeed | 9.8 km/h |
| Average gustspeed | 14.4 km/h |
| Average direction | 119° (ESE) |
| Rainfall for month | 0.8 mm |
| Rainfall for year | 182.0 mm |
| Maximum rain per minute | 0.2 mm on 01 at 07:02 |
| Maximum temperature | 18.2°C on 01 at 16:59 |
| Minimum temperature | 9.3°C on 01 at 23:59 |
| Maximum humidity | 95% on 01 at 07:33 |
| Minimum humidity | 59% on 01 at 18:03 |
| Maximum pressure | 1006.7 hPa on 01 at 00:00 |
| Minimum pressure | 1002.0 hPa on 01 at 18:12 |
| Maximum windspeed | 25.9 km/h on 01 at 20:41 |
| Maximum gust speed | 40.7 km/h from 075°(ENE) on 01 at 01:07 |
| Maximum heat index | 18.2°C on 01 at 16:59 |
Click here to toggle the 24 Hour Graph of this day
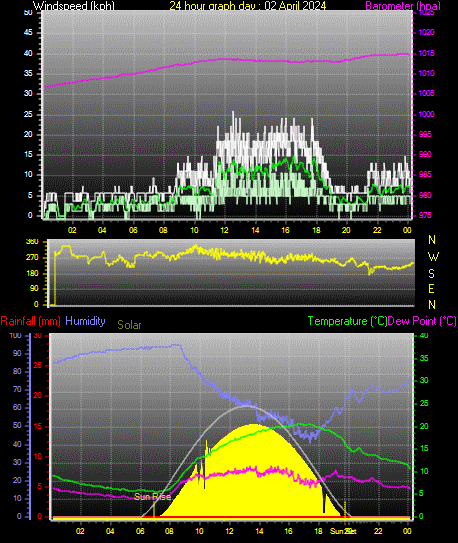
| 2 April Average and Extremes | |
| Average temperature | 12.9°C |
| Average humidity | 74% |
| Average dewpoint | 7.8°C |
| Average barometer | 1012.0 hPa |
| Average windspeed | 6.9 km/h |
| Average gustspeed | 9.7 km/h |
| Average direction | 269° (W) |
| Rainfall for month | 0.8 mm |
| Rainfall for year | 182.0 mm |
| Maximum rain per minute | 0.0 mm on 02 at 23:59 |
| Maximum temperature | 20.7°C on 02 at 16:41 |
| Minimum temperature | 5.6°C on 02 at 07:12 |
| Maximum humidity | 95% on 02 at 08:41 |
| Minimum humidity | 41% on 02 at 17:24 |
| Maximum pressure | 1014.9 hPa on 02 at 23:42 |
| Minimum pressure | 1006.7 hPa on 02 at 00:04 |
| Maximum windspeed | 16.7 km/h on 02 at 17:44 |
| Maximum gust speed | 25.9 km/h from 296°(WNW) on 02 at 12:32 |
| Maximum heat index | 25.3°C on 02 at 17:45 |
Click here to toggle the 24 Hour Graph of this day
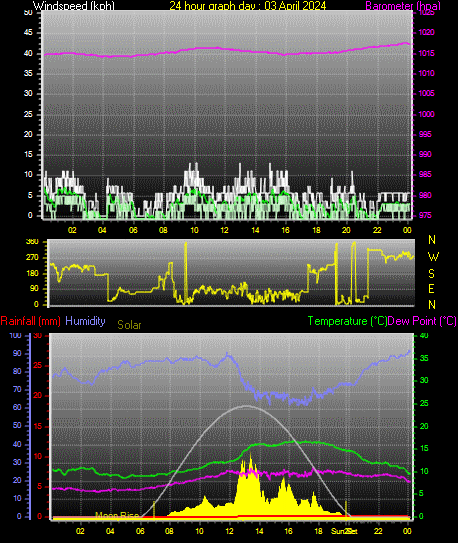
| 3 April Average and Extremes | |
| Average temperature | 12.3°C |
| Average humidity | 79% |
| Average dewpoint | 8.6°C |
| Average barometer | 1015.5 hPa |
| Average windspeed | 3.3 km/h |
| Average gustspeed | 5.0 km/h |
| Average direction | 70° (ENE) |
| Rainfall for month | 1.0 mm |
| Rainfall for year | 182.2 mm |
| Maximum rain per minute | 0.2 mm on 03 at 12:32 |
| Maximum temperature | 16.7°C on 03 at 17:06 |
| Minimum temperature | 8.7°C on 03 at 05:04 |
| Maximum humidity | 91% on 03 at 23:59 |
| Minimum humidity | 62% on 03 at 17:13 |
| Maximum pressure | 1017.6 hPa on 03 at 23:51 |
| Minimum pressure | 1014.2 hPa on 03 at 05:47 |
| Maximum windspeed | 9.3 km/h on 03 at 14:58 |
| Maximum gust speed | 13.0 km/h from 063°(ENE) on 03 at 14:57 |
| Maximum heat index | 16.7°C on 03 at 16:24 |
Click here to toggle the 24 Hour Graph of this day
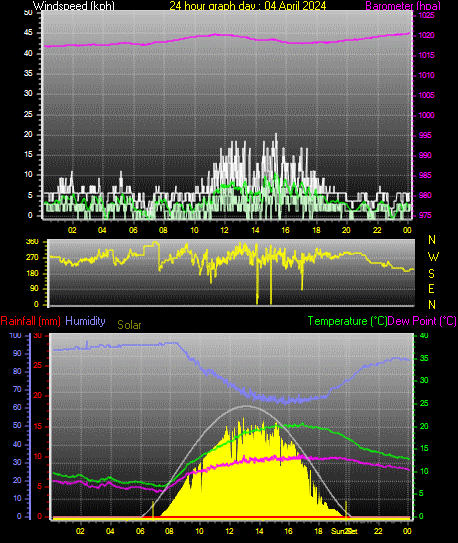
| 4 April Average and Extremes | |
| Average temperature | 13.7°C |
| Average humidity | 82% |
| Average dewpoint | 10.4°C |
| Average barometer | 1018.8 hPa |
| Average windspeed | 4.4 km/h |
| Average gustspeed | 6.4 km/h |
| Average direction | 270° (W) |
| Rainfall for month | 1.0 mm |
| Rainfall for year | 182.2 mm |
| Maximum rain per minute | 0.0 mm on 04 at 23:59 |
| Maximum temperature | 20.7°C on 04 at 16:54 |
| Minimum temperature | 6.8°C on 04 at 07:29 |
| Maximum humidity | 97% on 04 at 02:23 |
| Minimum humidity | 62% on 04 at 15:42 |
| Maximum pressure | 1020.5 hPa on 04 at 23:58 |
| Minimum pressure | 1017.3 hPa on 04 at 00:30 |
| Maximum windspeed | 14.8 km/h on 04 at 15:21 |
| Maximum gust speed | 20.4 km/h from 304°(NW) on 04 at 15:20 |
| Maximum heat index | 24.3°C on 04 at 15:42 |
Click here to toggle the 24 Hour Graph of this day
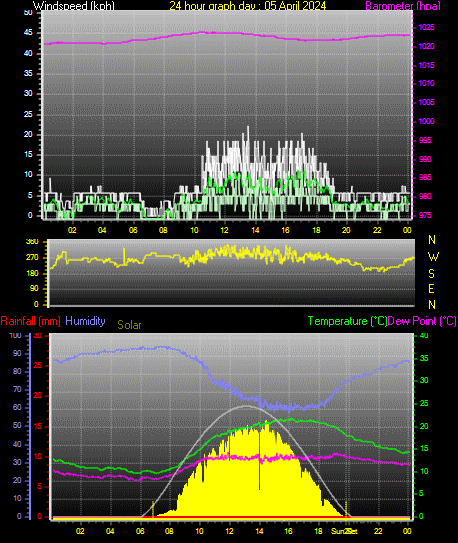
| 5 April Average and Extremes | |
| Average temperature | 15.5°C |
| Average humidity | 79% |
| Average dewpoint | 11.7°C |
| Average barometer | 1022.3 hPa |
| Average windspeed | 4.9 km/h |
| Average gustspeed | 7.2 km/h |
| Average direction | 271° (W) |
| Rainfall for month | 1.0 mm |
| Rainfall for year | 182.2 mm |
| Maximum rain per minute | 0.0 mm on 05 at 23:59 |
| Maximum temperature | 21.8°C on 05 at 16:11 |
| Minimum temperature | 9.7°C on 05 at 05:56 |
| Maximum humidity | 94% on 05 at 07:57 |
| Minimum humidity | 58% on 05 at 15:59 |
| Maximum pressure | 1024.0 hPa on 05 at 10:26 |
| Minimum pressure | 1020.6 hPa on 05 at 00:01 |
| Maximum windspeed | 16.7 km/h on 05 at 17:03 |
| Maximum gust speed | 22.2 km/h from 313°(NW) on 05 at 13:31 |
| Maximum heat index | 24.5°C on 05 at 15:59 |
Click here to toggle the 24 Hour Graph of this day
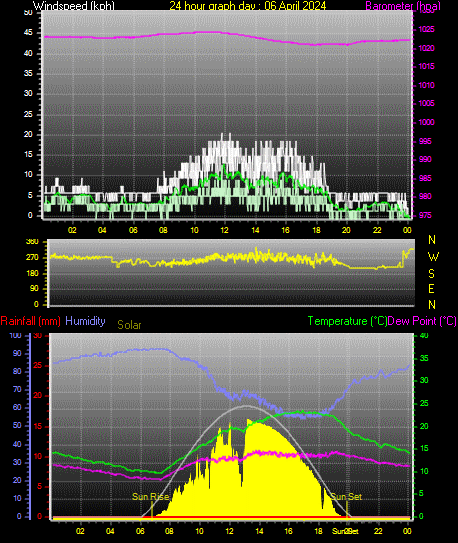
| 6 April Average and Extremes | |
| Average temperature | 16.4°C |
| Average humidity | 77% |
| Average dewpoint | 12.1°C |
| Average barometer | 1022.8 hPa |
| Average windspeed | 5.8 km/h |
| Average gustspeed | 8.2 km/h |
| Average direction | 261° (W) |
| Rainfall for month | 1.0 mm |
| Rainfall for year | 182.2 mm |
| Maximum rain per minute | 0.0 mm on 06 at 23:59 |
| Maximum temperature | 23.6°C on 06 at 16:54 |
| Minimum temperature | 9.7°C on 06 at 07:21 |
| Maximum humidity | 93% on 06 at 07:47 |
| Minimum humidity | 54% on 06 at 17:02 |
| Maximum pressure | 1024.6 hPa on 06 at 10:32 |
| Minimum pressure | 1021.0 hPa on 06 at 17:53 |
| Maximum windspeed | 18.5 km/h on 06 at 11:47 |
| Maximum gust speed | 20.4 km/h from 306°(NW) on 06 at 12:19 |
| Maximum heat index | 25.2°C on 06 at 16:54 |
Click here to toggle the 24 Hour Graph of this day
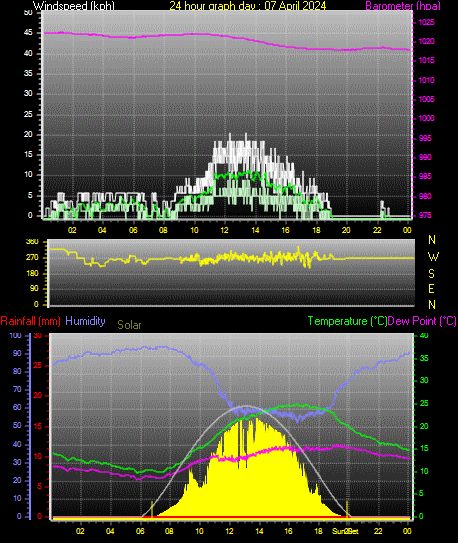
| 7 April Average and Extremes | |
| Average temperature | 17.0°C |
| Average humidity | 78% |
| Average dewpoint | 12.7°C |
| Average barometer | 1020.4 hPa |
| Average windspeed | 3.9 km/h |
| Average gustspeed | 5.6 km/h |
| Average direction | 268° (W) |
| Rainfall for month | 1.0 mm |
| Rainfall for year | 182.2 mm |
| Maximum rain per minute | 0.0 mm on 07 at 23:59 |
| Maximum temperature | 25.1°C on 07 at 16:33 |
| Minimum temperature | 9.8°C on 07 at 05:48 |
| Maximum humidity | 94% on 07 at 07:49 |
| Minimum humidity | 52% on 07 at 16:33 |
| Maximum pressure | 1022.5 hPa on 07 at 01:12 |
| Minimum pressure | 1018.0 hPa on 07 at 19:23 |
| Maximum windspeed | 14.8 km/h on 07 at 14:31 |
| Maximum gust speed | 20.4 km/h from 263°(W) on 07 at 13:22 |
| Maximum heat index | 26.0°C on 07 at 16:32 |
Click here to toggle the 24 Hour Graph of this day
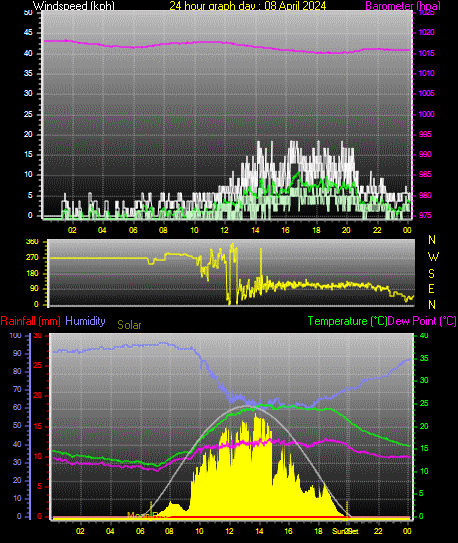
| 8 April Average and Extremes | |
| Average temperature | 18.1°C |
| Average humidity | 80% |
| Average dewpoint | 14.2°C |
| Average barometer | 1016.7 hPa |
| Average windspeed | 3.6 km/h |
| Average gustspeed | 5.7 km/h |
| Average direction | 115° (ESE) |
| Rainfall for month | 1.0 mm |
| Rainfall for year | 182.2 mm |
| Maximum rain per minute | 0.0 mm on 08 at 23:59 |
| Maximum temperature | 24.9°C on 08 at 14:06 |
| Minimum temperature | 11.3°C on 08 at 07:11 |
| Maximum humidity | 96% on 08 at 07:50 |
| Minimum humidity | 58% on 08 at 14:19 |
| Maximum pressure | 1018.3 hPa on 08 at 01:30 |
| Minimum pressure | 1015.1 hPa on 08 at 19:30 |
| Maximum windspeed | 13.0 km/h on 08 at 18:34 |
| Maximum gust speed | 18.5 km/h from 091°(E) on 08 at 19:38 |
| Maximum heat index | 25.9°C on 08 at 14:06 |
Click here to toggle the 24 Hour Graph of this day
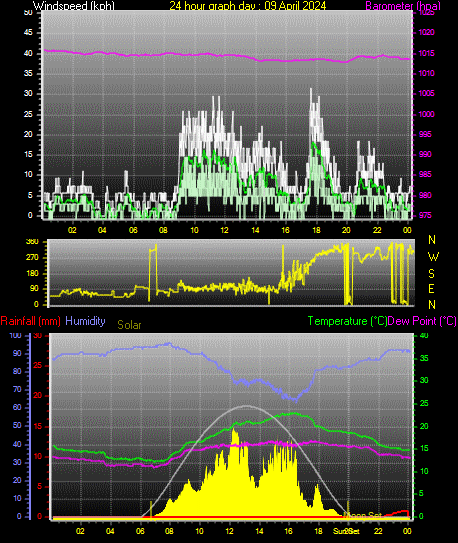
| 9 April Average and Extremes | |
| Average temperature | 17.1°C |
| Average humidity | 85% |
| Average dewpoint | 14.5°C |
| Average barometer | 1014.4 hPa |
| Average windspeed | 6.5 km/h |
| Average gustspeed | 9.6 km/h |
| Average direction | 78° (ENE) |
| Rainfall for month | 2.0 mm |
| Rainfall for year | 183.2 mm |
| Maximum rain per minute | 0.2 mm on 09 at 23:14 |
| Maximum temperature | 23.0°C on 09 at 16:29 |
| Minimum temperature | 12.2°C on 09 at 06:56 |
| Maximum humidity | 96% on 09 at 08:02 |
| Minimum humidity | 63% on 09 at 16:29 |
| Maximum pressure | 1015.9 hPa on 09 at 00:07 |
| Minimum pressure | 1012.9 hPa on 09 at 19:37 |
| Maximum windspeed | 22.2 km/h on 09 at 18:03 |
| Maximum gust speed | 31.5 km/h from 281°(W) on 09 at 17:38 |
| Maximum heat index | 24.6°C on 09 at 16:29 |
Click here to toggle the 24 Hour Graph of this day
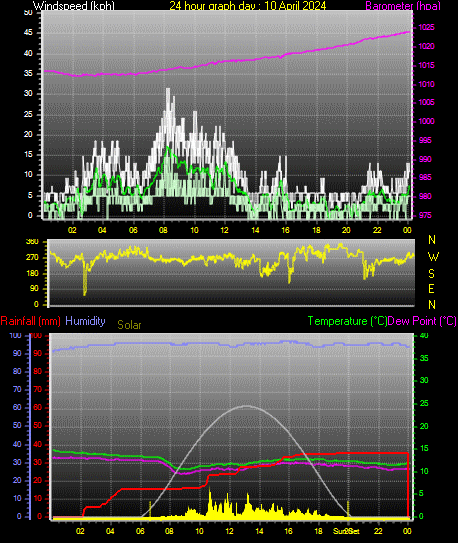
| 10 April Average and Extremes | |
| Average temperature | 12.6°C |
| Average humidity | 95% |
| Average dewpoint | 11.8°C |
| Average barometer | 1016.6 hPa |
| Average windspeed | 6.6 km/h |
| Average gustspeed | 9.6 km/h |
| Average direction | 267° (W) |
| Rainfall for month | 37.4 mm |
| Rainfall for year | 218.6 mm |
| Maximum rain per minute | 1.2 mm on 10 at 02:11 |
| Maximum temperature | 14.8°C on 10 at 00:01 |
| Minimum temperature | 10.6°C on 10 at 09:15 |
| Maximum humidity | 97% on 10 at 16:31 |
| Minimum humidity | 91% on 10 at 00:11 |
| Maximum pressure | 1024.0 hPa on 10 at 23:58 |
| Minimum pressure | 1012.2 hPa on 10 at 02:28 |
| Maximum windspeed | 22.2 km/h on 10 at 08:11 |
| Maximum gust speed | 31.5 km/h from 263°(W) on 10 at 08:19 |
| Maximum heat index | 14.8°C on 10 at 00:01 |
Click here to toggle the 24 Hour Graph of this day
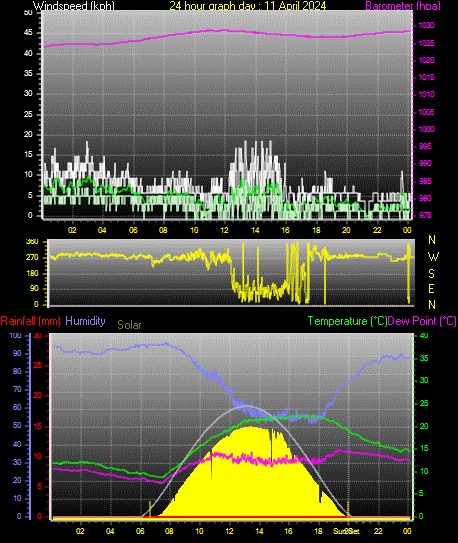
| 11 April Average and Extremes | |
| Average temperature | 16.0°C |
| Average humidity | 79% |
| Average dewpoint | 11.9°C |
| Average barometer | 1027.0 hPa |
| Average windspeed | 5.2 km/h |
| Average gustspeed | 7.4 km/h |
| Average direction | 284° (WNW) |
| Rainfall for month | 37.4 mm |
| Rainfall for year | 218.6 mm |
| Maximum rain per minute | 0.0 mm on 11 at 23:59 |
| Maximum temperature | 22.6°C on 11 at 16:33 |
| Minimum temperature | 8.7°C on 11 at 07:29 |
| Maximum humidity | 96% on 11 at 07:50 |
| Minimum humidity | 52% on 11 at 17:42 |
| Maximum pressure | 1028.9 hPa on 11 at 11:08 |
| Minimum pressure | 1024.0 hPa on 11 at 00:01 |
| Maximum windspeed | 14.8 km/h on 11 at 13:21 |
| Maximum gust speed | 18.5 km/h from 111°(ESE) on 11 at 14:59 |
| Maximum heat index | 24.9°C on 11 at 17:31 |
Click here to toggle the 24 Hour Graph of this day
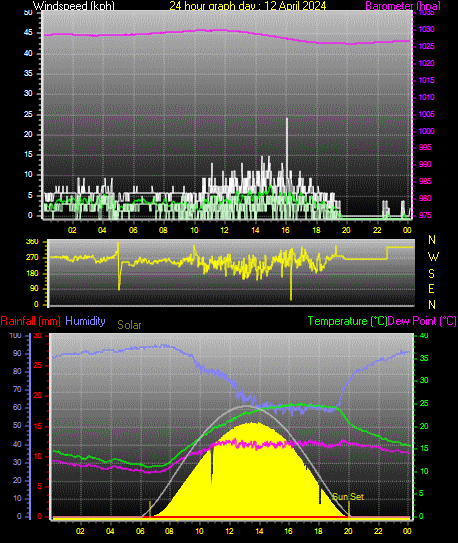
| 12 April Average and Extremes | |
| Average temperature | 18.0°C |
| Average humidity | 80% |
| Average dewpoint | 14.2°C |
| Average barometer | 1028.2 hPa |
| Average windspeed | 3.4 km/h |
| Average gustspeed | 4.8 km/h |
| Average direction | 255° (WSW) |
| Rainfall for month | 37.4 mm |
| Rainfall for year | 218.6 mm |
| Maximum rain per minute | 0.0 mm on 12 at 23:59 |
| Maximum temperature | 25.2°C on 12 at 16:09 |
| Minimum temperature | 11.1°C on 12 at 06:39 |
| Maximum humidity | 95% on 12 at 07:55 |
| Minimum humidity | 56% on 12 at 16:13 |
| Maximum pressure | 1030.1 hPa on 12 at 10:20 |
| Minimum pressure | 1026.0 hPa on 12 at 19:59 |
| Maximum windspeed | 11.1 km/h on 12 at 16:04 |
| Maximum gust speed | 24.1 km/h from 314°(NW) on 12 at 16:03 |
| Maximum heat index | 26.1°C on 12 at 16:09 |
Click here to toggle the 24 Hour Graph of this day
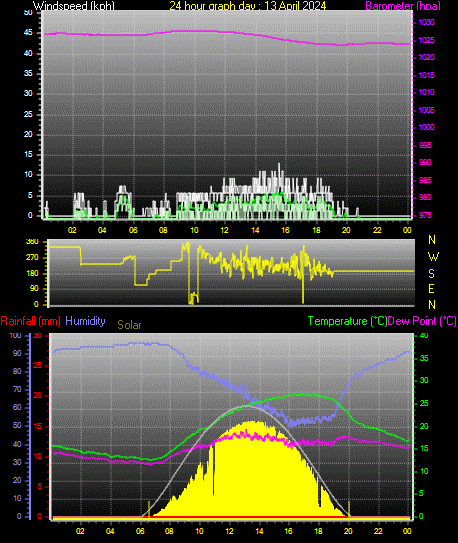
| 13 April Average and Extremes | |
| Average temperature | 19.6°C |
| Average humidity | 79% |
| Average dewpoint | 15.4°C |
| Average barometer | 1026.1 hPa |
| Average windspeed | 1.9 km/h |
| Average gustspeed | 3.0 km/h |
| Average direction | 230° (SW) |
| Rainfall for month | 37.4 mm |
| Rainfall for year | 218.6 mm |
| Maximum rain per minute | 0.0 mm on 13 at 23:59 |
| Maximum temperature | 27.4°C on 13 at 16:57 |
| Minimum temperature | 12.6°C on 13 at 06:46 |
| Maximum humidity | 96% on 13 at 07:13 |
| Minimum humidity | 49% on 13 at 16:10 |
| Maximum pressure | 1027.9 hPa on 13 at 10:30 |
| Minimum pressure | 1023.7 hPa on 13 at 19:30 |
| Maximum windspeed | 9.3 km/h on 13 at 15:33 |
| Maximum gust speed | 13.0 km/h from 219°(SW) on 13 at 15:33 |
| Maximum heat index | 28.1°C on 13 at 16:57 |
Click here to toggle the 24 Hour Graph of this day
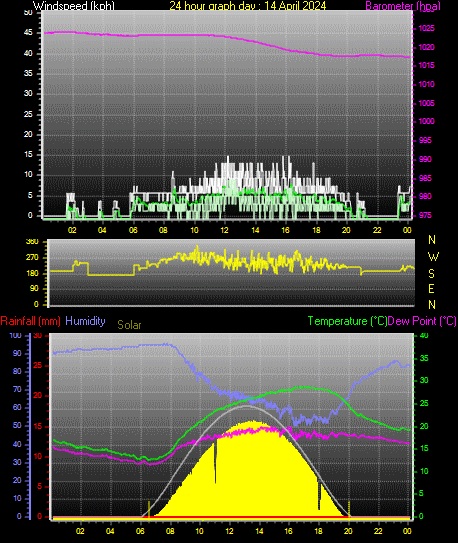
| 14 April Average and Extremes | |
| Average temperature | 20.9°C |
| Average humidity | 78% |
| Average dewpoint | 16.4°C |
| Average barometer | 1021.3 hPa |
| Average windspeed | 3.2 km/h |
| Average gustspeed | 4.6 km/h |
| Average direction | 236° (SW) |
| Rainfall for month | 37.4 mm |
| Rainfall for year | 218.6 mm |
| Maximum rain per minute | 0.0 mm on 14 at 23:59 |
| Maximum temperature | 28.8°C on 14 at 17:19 |
| Minimum temperature | 12.6°C on 14 at 06:37 |
| Maximum humidity | 96% on 14 at 07:46 |
| Minimum humidity | 50% on 14 at 16:30 |
| Maximum pressure | 1024.2 hPa on 14 at 01:46 |
| Minimum pressure | 1017.5 hPa on 14 at 23:58 |
| Maximum windspeed | 11.1 km/h on 14 at 16:11 |
| Maximum gust speed | 14.8 km/h from 270°(W) on 14 at 16:10 |
| Maximum heat index | 30.0°C on 14 at 16:51 |
Click here to toggle the 24 Hour Graph of this day
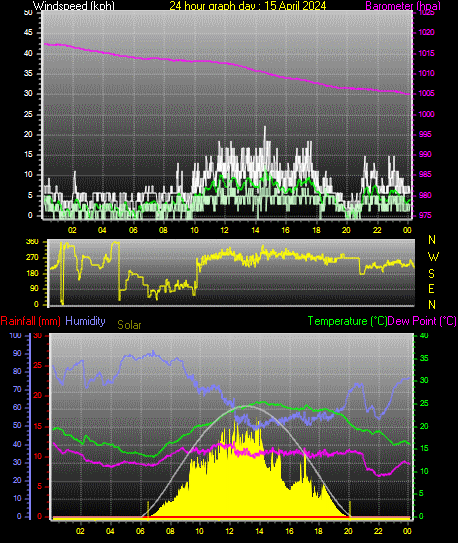
| 15 April Average and Extremes | |
| Average temperature | 19.7°C |
| Average humidity | 69% |
| Average dewpoint | 13.6°C |
| Average barometer | 1011.4 hPa |
| Average windspeed | 5.1 km/h |
| Average gustspeed | 7.3 km/h |
| Average direction | 265° (W) |
| Rainfall for month | 37.4 mm |
| Rainfall for year | 218.6 mm |
| Maximum rain per minute | 0.0 mm on 15 at 23:59 |
| Maximum temperature | 25.5°C on 15 at 14:18 |
| Minimum temperature | 13.3°C on 15 at 06:54 |
| Maximum humidity | 92% on 15 at 06:49 |
| Minimum humidity | 48% on 15 at 13:50 |
| Maximum pressure | 1017.5 hPa on 15 at 00:04 |
| Minimum pressure | 1005.0 hPa on 15 at 23:56 |
| Maximum windspeed | 16.7 km/h on 15 at 14:34 |
| Maximum gust speed | 22.2 km/h from 296°(WNW) on 15 at 14:34 |
| Maximum heat index | 26.2°C on 15 at 14:16 |
Click here to toggle the 24 Hour Graph of this day
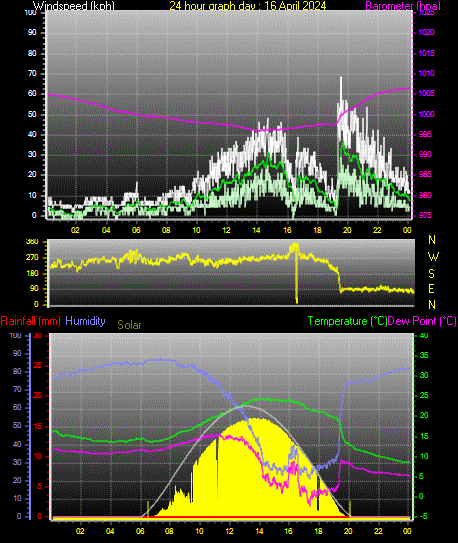
| 16 April Average and Extremes | |
| Average temperature | 16.9°C |
| Average humidity | 67% |
| Average dewpoint | 9.5°C |
| Average barometer | 1000.1 hPa |
| Average windspeed | 13.2 km/h |
| Average gustspeed | 19.2 km/h |
| Average direction | 258° (WSW) |
| Rainfall for month | 37.4 mm |
| Rainfall for year | 218.6 mm |
| Maximum rain per minute | 0.0 mm on 16 at 23:59 |
| Maximum temperature | 24.5°C on 16 at 14:35 |
| Minimum temperature | 8.6°C on 16 at 23:59 |
| Maximum humidity | 88% on 16 at 07:21 |
| Minimum humidity | 21% on 16 at 17:22 |
| Maximum pressure | 1006.4 hPa on 16 at 23:59 |
| Minimum pressure | 995.9 hPa on 16 at 14:05 |
| Maximum windspeed | 42.6 km/h on 16 at 19:32 |
| Maximum gust speed | 68.5 km/h from 057°(ENE) on 16 at 19:34 |
| Maximum heat index | 25.5°C on 16 at 13:53 |
Click here to toggle the 24 Hour Graph of this day
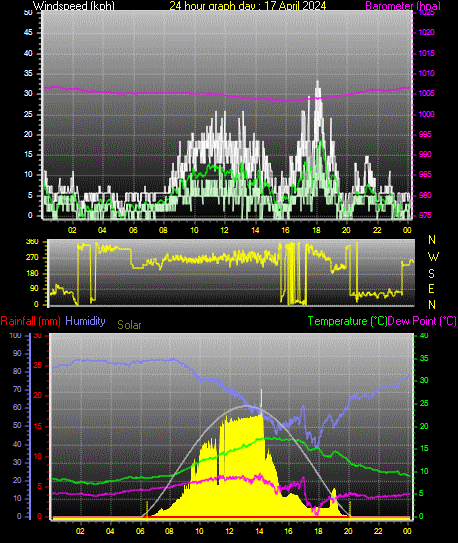
| 17 April Average and Extremes | |
| Average temperature | 11.7°C |
| Average humidity | 72% |
| Average dewpoint | 6.4°C |
| Average barometer | 1005.1 hPa |
| Average windspeed | 6.3 km/h |
| Average gustspeed | 9.3 km/h |
| Average direction | 287° (WNW) |
| Rainfall for month | 37.4 mm |
| Rainfall for year | 218.6 mm |
| Maximum rain per minute | 0.0 mm on 17 at 23:59 |
| Maximum temperature | 17.6°C on 17 at 14:59 |
| Minimum temperature | 7.3°C on 17 at 03:08 |
| Maximum humidity | 88% on 17 at 08:14 |
| Minimum humidity | 38% on 17 at 17:54 |
| Maximum pressure | 1006.8 hPa on 17 at 00:56 |
| Minimum pressure | 1003.2 hPa on 17 at 16:09 |
| Maximum windspeed | 24.1 km/h on 17 at 18:04 |
| Maximum gust speed | 33.3 km/h from 288°(WNW) on 17 at 18:04 |
| Maximum heat index | 17.6°C on 17 at 14:59 |
Click here to toggle the 24 Hour Graph of this day
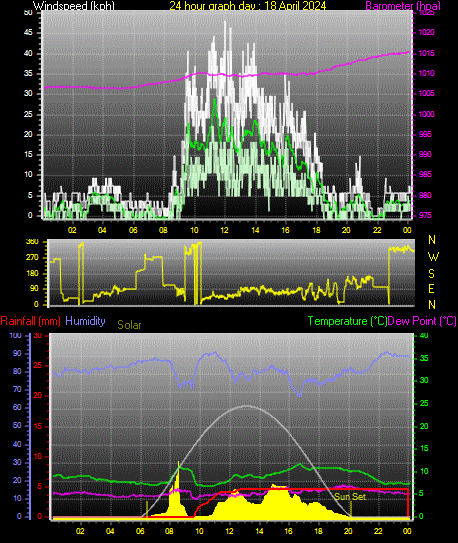
| 18 April Average and Extremes | |
| Average temperature | 8.9°C |
| Average humidity | 82% |
| Average dewpoint | 5.9°C |
| Average barometer | 1009.6 hPa |
| Average windspeed | 8.2 km/h |
| Average gustspeed | 12.2 km/h |
| Average direction | 62° (ENE) |
| Rainfall for month | 42.0 mm |
| Rainfall for year | 223.2 mm |
| Maximum rain per minute | 0.2 mm on 18 at 12:27 |
| Maximum temperature | 11.7°C on 18 at 16:48 |
| Minimum temperature | 6.8°C on 18 at 10:29 |
| Maximum humidity | 91% on 18 at 22:40 |
| Minimum humidity | 67% on 18 at 16:46 |
| Maximum pressure | 1015.3 hPa on 18 at 23:59 |
| Minimum pressure | 1006.3 hPa on 18 at 04:59 |
| Maximum windspeed | 35.2 km/h on 18 at 11:14 |
| Maximum gust speed | 48.1 km/h from 043°(NE) on 18 at 11:59 |
| Maximum heat index | 11.7°C on 18 at 16:48 |
Click here to toggle the 24 Hour Graph of this day
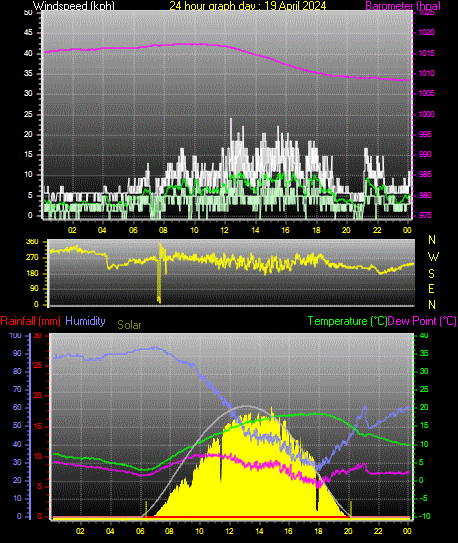
| 19 April Average and Extremes | |
| Average temperature | 11.3°C |
| Average humidity | 65% |
| Average dewpoint | 3.9°C |
| Average barometer | 1014.0 hPa |
| Average windspeed | 6.2 km/h |
| Average gustspeed | 8.9 km/h |
| Average direction | 248° (WSW) |
| Rainfall for month | 42.0 mm |
| Rainfall for year | 223.2 mm |
| Maximum rain per minute | 0.0 mm on 19 at 23:59 |
| Maximum temperature | 18.7°C on 19 at 17:43 |
| Minimum temperature | 3.1°C on 19 at 06:23 |
| Maximum humidity | 94% on 19 at 07:06 |
| Minimum humidity | 26% on 19 at 18:03 |
| Maximum pressure | 1017.4 hPa on 19 at 09:10 |
| Minimum pressure | 1008.4 hPa on 19 at 23:49 |
| Maximum windspeed | 14.8 km/h on 19 at 14:29 |
| Maximum gust speed | 24.1 km/h from 213°(SSW) on 19 at 12:23 |
| Maximum heat index | 18.7°C on 19 at 17:43 |
Click here to toggle the 24 Hour Graph of this day
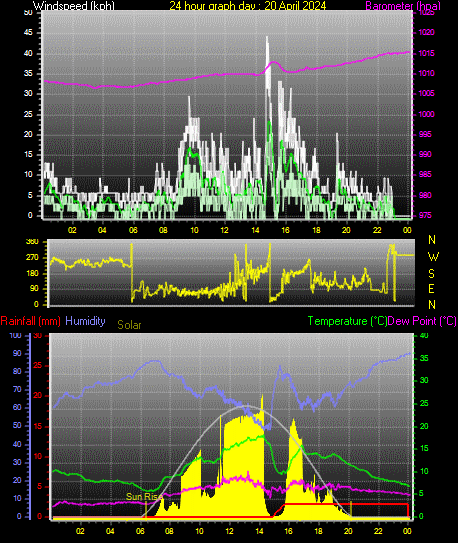
| 20 April Average and Extremes | |
| Average temperature | 10.9°C |
| Average humidity | 72% |
| Average dewpoint | 5.9°C |
| Average barometer | 1010.0 hPa |
| Average windspeed | 5.9 km/h |
| Average gustspeed | 8.8 km/h |
| Average direction | 125° (SE) |
| Rainfall for month | 44.2 mm |
| Rainfall for year | 225.4 mm |
| Maximum rain per minute | 0.2 mm on 20 at 15:43 |
| Maximum temperature | 18.1°C on 20 at 14:17 |
| Minimum temperature | 5.7°C on 20 at 06:26 |
| Maximum humidity | 90% on 20 at 23:59 |
| Minimum humidity | 48% on 20 at 14:44 |
| Maximum pressure | 1015.4 hPa on 20 at 23:56 |
| Minimum pressure | 1006.5 hPa on 20 at 03:28 |
| Maximum windspeed | 25.9 km/h on 20 at 14:56 |
| Maximum gust speed | 44.4 km/h from 040°(NE) on 20 at 14:43 |
| Maximum heat index | 18.1°C on 20 at 14:17 |
Click here to toggle the 24 Hour Graph of this day
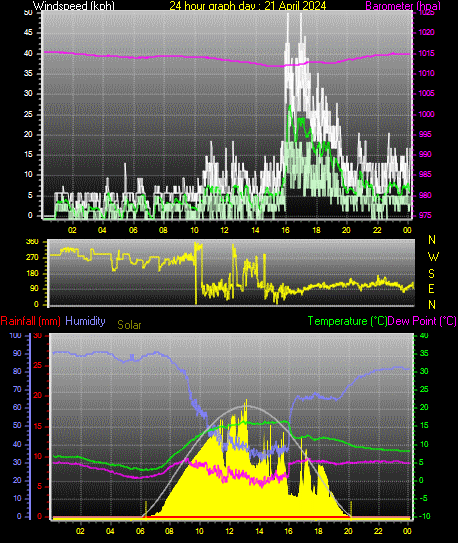
| 21 April Average and Extremes | |
| Average temperature | 9.7°C |
| Average humidity | 70% |
| Average dewpoint | 3.9°C |
| Average barometer | 1013.8 hPa |
| Average windspeed | 6.7 km/h |
| Average gustspeed | 9.9 km/h |
| Average direction | 108° (ESE) |
| Rainfall for month | 44.2 mm |
| Rainfall for year | 225.4 mm |
| Maximum rain per minute | 0.0 mm on 21 at 23:59 |
| Maximum temperature | 16.6°C on 21 at 15:44 |
| Minimum temperature | 3.1°C on 21 at 06:33 |
| Maximum humidity | 91% on 21 at 07:15 |
| Minimum humidity | 31% on 21 at 14:09 |
| Maximum pressure | 1015.4 hPa on 21 at 00:33 |
| Minimum pressure | 1011.8 hPa on 21 at 15:39 |
| Maximum windspeed | 33.3 km/h on 21 at 16:11 |
| Maximum gust speed | 50.0 km/h from 069°(ENE) on 21 at 16:58 |
| Maximum heat index | 16.6°C on 21 at 15:44 |
Click here to toggle the 24 Hour Graph of this day
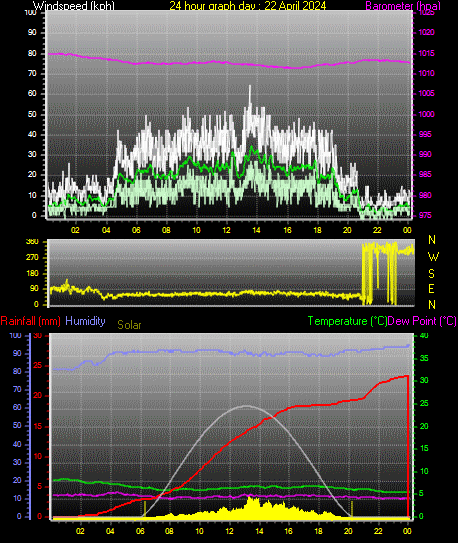
| 22 April Average and Extremes | |
| Average temperature | 6.6°C |
| Average humidity | 90% |
| Average dewpoint | 5.1°C |
| Average barometer | 1012.9 hPa |
| Average windspeed | 17.6 km/h |
| Average gustspeed | 25.9 km/h |
| Average direction | 62° (ENE) |
| Rainfall for month | 67.8 mm |
| Rainfall for year | 249.0 mm |
| Maximum rain per minute | 0.2 mm on 22 at 23:58 |
| Maximum temperature | 8.4°C on 22 at 01:06 |
| Minimum temperature | 5.4°C on 22 at 23:42 |
| Maximum humidity | 95% on 22 at 23:59 |
| Minimum humidity | 81% on 22 at 01:28 |
| Maximum pressure | 1015.1 hPa on 22 at 00:52 |
| Minimum pressure | 1011.3 hPa on 22 at 16:34 |
| Maximum windspeed | 42.6 km/h on 22 at 13:30 |
| Maximum gust speed | 64.8 km/h from 059°(ENE) on 22 at 13:29 |
| Maximum heat index | 8.4°C on 22 at 01:06 |
Click here to toggle the 24 Hour Graph of this day
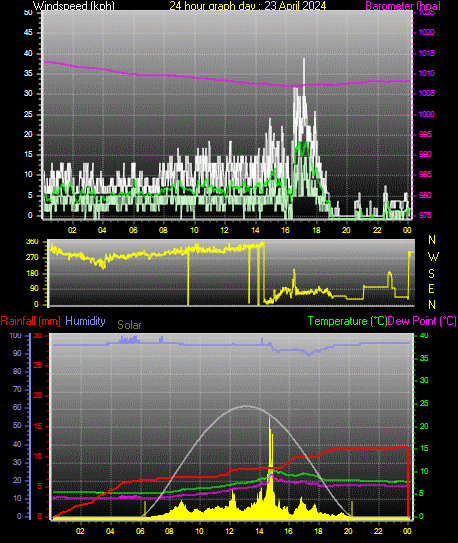
| 23 April Average and Extremes | |
| Average temperature | 7.1°C |
| Average humidity | 95% |
| Average dewpoint | 6.3°C |
| Average barometer | 1009.0 hPa |
| Average windspeed | 6.1 km/h |
| Average gustspeed | 8.7 km/h |
| Average direction | 337° (NNW) |
| Rainfall for month | 79.4 mm |
| Rainfall for year | 260.6 mm |
| Maximum rain per minute | 0.2 mm on 23 at 22:46 |
| Maximum temperature | 10.7°C on 23 at 14:53 |
| Minimum temperature | 5.2°C on 23 at 07:06 |
| Maximum humidity | 100% on 23 at 07:27 |
| Minimum humidity | 89% on 23 at 17:20 |
| Maximum pressure | 1013.0 hPa on 23 at 00:22 |
| Minimum pressure | 1006.9 hPa on 23 at 16:13 |
| Maximum windspeed | 22.2 km/h on 23 at 16:35 |
| Maximum gust speed | 38.9 km/h from 065°(ENE) on 23 at 17:09 |
| Maximum heat index | 10.7°C on 23 at 14:53 |
Click here to toggle the 24 Hour Graph of this day
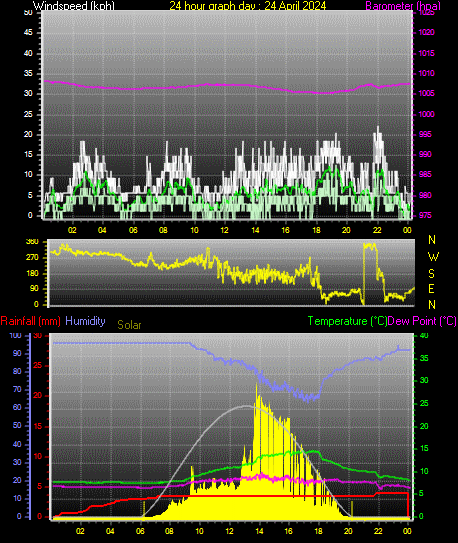
| 24 April Average and Extremes | |
| Average temperature | 10.0°C |
| Average humidity | 87% |
| Average dewpoint | 7.9°C |
| Average barometer | 1006.7 hPa |
| Average windspeed | 6.2 km/h |
| Average gustspeed | 9.1 km/h |
| Average direction | 233° (SW) |
| Rainfall for month | 83.4 mm |
| Rainfall for year | 264.6 mm |
| Maximum rain per minute | 0.2 mm on 24 at 21:49 |
| Maximum temperature | 14.8°C on 24 at 17:37 |
| Minimum temperature | 7.5°C on 24 at 06:47 |
| Maximum humidity | 96% on 24 at 09:22 |
| Minimum humidity | 63% on 24 at 17:15 |
| Maximum pressure | 1008.3 hPa on 24 at 00:10 |
| Minimum pressure | 1005.3 hPa on 24 at 18:24 |
| Maximum windspeed | 16.7 km/h on 24 at 19:16 |
| Maximum gust speed | 22.2 km/h from 123°(ESE) on 24 at 22:00 |
| Maximum heat index | 14.8°C on 24 at 17:37 |
Click here to toggle the 24 Hour Graph of this day
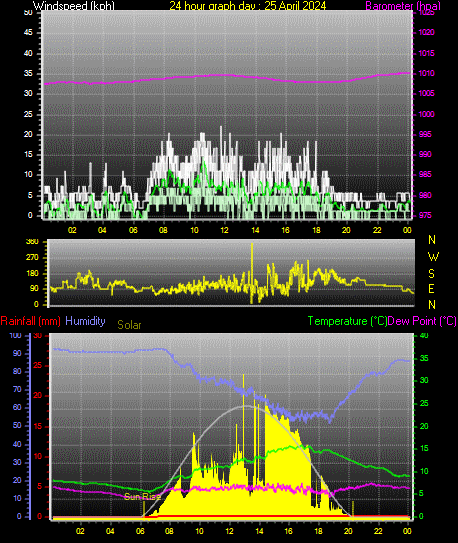
| 25 April Average and Extremes | |
| Average temperature | 10.5°C |
| Average humidity | 77% |
| Average dewpoint | 6.4°C |
| Average barometer | 1008.7 hPa |
| Average windspeed | 4.9 km/h |
| Average gustspeed | 7.6 km/h |
| Average direction | 113° (ESE) |
| Rainfall for month | 83.6 mm |
| Rainfall for year | 264.8 mm |
| Maximum rain per minute | 0.2 mm on 25 at 07:09 |
| Maximum temperature | 15.9°C on 25 at 16:51 |
| Minimum temperature | 5.6°C on 25 at 06:39 |
| Maximum humidity | 93% on 25 at 07:40 |
| Minimum humidity | 52% on 25 at 18:43 |
| Maximum pressure | 1010.2 hPa on 25 at 23:45 |
| Minimum pressure | 1007.5 hPa on 25 at 03:09 |
| Maximum windspeed | 16.7 km/h on 25 at 10:35 |
| Maximum gust speed | 22.2 km/h from 119°(ESE) on 25 at 11:44 |
| Maximum heat index | 15.9°C on 25 at 16:51 |
Click here to toggle the 24 Hour Graph of this day
| Average and Extremes for Month of April 2024 up to day 25 | |
| Average temperature | 13.9°C |
| Average humidity | 79% |
| Average dewpoint | 9.9°C |
| Average barometer | 1014.7 hPa |
| Average windspeed | 6.2 km/h |
| Average gustspeed | 9.1 km/h |
| Average direction | 271° (W) |
| Rainfall for month | 83.6 mm |
| Rainfall for year | 264.8 mm |
| Maximum rain per minute | 1.2 mm on 10 at 02:11 |
| Maximum temperature | 28.8°C on 14 at 17:19 |
| Minimum temperature | 3.1°C on 21 at 06:33 |
| Maximum humidity | 100% on 23 at 07:27 |
| Minimum humidity | 21% on 16 at 17:22 |
| Maximum pressure | 1030.1 hPa on 12 at 10:20 |
| Minimum pressure | 995.9 hPa on 16 at 14:05 |
| Maximum windspeed | 42.6 kmh from 053°(NE) on 22 at 13:30 |
| Maximum gust speed | 68.5 km/h from 090°(E) on 16 at 19:34 |
| Maximum heat index | 30.0°C on 14 at 16:51 |
| Avg daily max temp | 19.8°C |
| Avg daily min temp | 8.4°C |
| Growing degrees days | 129.7 GDD |
| Day, Sunshine Hours, ET, Max Solar, UV ore di luce sono calcolate con intensità solare oltre il 75% |
|||
| 01 01:12hrs | ET :1.6 mm | 693.0 W/m² | 1.2 uv |
| 02 07:36hrs | ET :3.5 mm | 773.0 W/m² | 2.6 uv |
| 03 00:00hrs | ET :1.3 mm | 545.0 W/m² | 2.8 uv |
| 04 05:00hrs | ET :3.2 mm | 826.0 W/m² | 3.2 uv |
| 05 05:06hrs | ET :3.7 mm | 802.0 W/m² | 3.1 uv |
| 06 06:12hrs | ET :3.9 mm | 814.0 W/m² | 3.2 uv |
| 07 04:54hrs | ET :3.5 mm | 868.0 W/m² | 3.5 uv |
| 08 03:30hrs | ET :3.0 mm | 861.0 W/m² | 3.3 uv |
| 09 01:06hrs | ET :2.7 mm | 747.0 W/m² | 2.6 uv |
| 10 00:00hrs | ET :0.5 mm | 274.0 W/m² | 1.1 uv |
| 11 06:42hrs | ET :3.9 mm | 752.0 W/m² | 3.3 uv |
| 12 07:30hrs | ET :4.1 mm | 788.0 W/m² | 3.5 uv |
| 13 07:36hrs | ET :3.9 mm | 798.0 W/m² | 4.2 uv |
| 14 08:18hrs | ET :4.3 mm | 807.0 W/m² | 4.5 uv |
| 15 02:42hrs | ET :3.4 mm | 849.0 W/m² | 4.1 uv |
| 16 09:12hrs | ET :5.4 mm | 828.0 W/m² | 3.5 uv |
| 17 04:42hrs | ET :3.4 mm | 1058.0 W/m² | 3.6 uv |
| 18 00:30hrs | ET :1.4 mm | 468.0 W/m² | 1.1 uv |
| 19 08:24hrs | ET :4.1 mm | 916.0 W/m² | 3.7 uv |
| 20 05:48hrs | ET :3.0 mm | 1027.0 W/m² | 3.3 uv |
| 21 06:36hrs | ET :3.2 mm | 976.0 W/m² | 3.4 uv |
| 22 00:00hrs | ET :0.9 mm | 179.0 W/m² | 0.8 uv |
| 23 00:12hrs | ET :0.8 mm | 988.0 W/m² | 3.2 uv |
| 24 04:06hrs | ET :2.6 mm | 1116.0 W/m² | 3.8 uv |
| 25 04:48hrs | ET :3.1 mm | 1185.0 W/m² | 4.0 uv |
| Daily Rain Totals | |
| 00.8 mm on 1 | |
| 00.2 mm on 3 | |
| 01.0 mm on 9 | |
| 35.4 mm on 10 | |
| 04.6 mm on 18 | |
| 02.2 mm on 20 | |
| 23.6 mm on 22 | |
| 11.6 mm on 23 | |
| 04.0 mm on 24 | |
| 00.2 mm on 25 | |
Nevicata con fiocchi più grandi
Montana - USA
Nella spettacolare nevicata del 1994 caddero fiocchi del diametro di 40 cm.


