


..:: Dashboard ::..

METRIC |
IMPERIAL
Updated:
26/04/2024 @ 06:57 - LOADING DATA...PLEASE WAIT
(0 sec ago)
Temperature
|
|
Currently Outside:
6.7°C Freddo 24-hr diff. 0.7°C |
|
 |
|
High Today 9.4°C 00:34 |
Low Today 6.4°C 06:26 |
|
Yest High 15.9°C 16:46 |
Yest Low 5.6°C 06:32 |
|
Sta* High 27.6°C 2018 |
Sta* Low 6.2°C 2023 |
|
* Record since 2010 for the day 26 April |
|
Current Conditions
|
Nessun fenomeno in atto
Leggera Foschia Clima Tendente al Freddo e Molto Umido Bava di vento Barometric pressure is Steady |
|

|
Wind to: NE to: 4.6 Gusting to: 6.4 km/h |

|
Rain: 0.0 mm |
|
Fire Risk Chandler Burning Index -1.8 of 100 |
 |
|
Forecast / Storm Prediction
|
Rest of tonight  Cloudy |
Friday Mostly Cloudy |
Friday night  Mostly Cloudy |
Saturday Mostly Cloudy |
| Low: 6°C | High: 16°C | Low: 9°C | High: 19°C |
|
Click here for full Forecast |
|||

|
|||
Dew Point
| Current: |
|
| In Last Hour: |
|
| High 00:34: | 7.2°C |
| Low 06:26: | 5.0°C |
| Record High: |
26.9°C on 3-Aug-2017 |
| Record Low: |
-16.9°C on 7-Apr-2021 |
| Wetbulb: | 6.1°C |
 |
|
Humidity
| Current: |
|
| In Last Hour: |
|
| High: | 91% at 04:43 |
| Low: | 85% at 00:42 |
| Record High: |
100% on 26-Oct-2010 |
| Record Low: |
11% on 7-Apr-2021 |
| Humidex: |
43.0°C |
 |
|
Barometer
| Current: |
|
| Last Hour: | Steady |
| Latest 3 hours: | +0.3 hPa |
| High at 06:55: | 1011.0 |
| Low at 00:00: | 1010.2 |
| Record High: |
1045.4 hPa on 20-Jan-2020 |
| Record Low: |
976.0 hPa on 30-Jan-2015 |
 |
|
Wind Speed
|
|
|
| Current: | 4.6 km/h |
| Wind to: | NE |
| 1Hr Average: | 4.8 km/h |
| Wind Run: | 33.98 km |
| Wind Gust | |
| Current: | 6.4 km/h |
| Today: | 13.0 km/h at 02:38 |
| Month: | 69.2 km/h on 16-Apr |
| Year: | 69.2 km/h on 16-Apr |
| Record Gust: |
118.4 km/h 14-Jun-2015 |
 |
|
Liquid Precipitation
| Today: | 0.00 mm |
| Yesterday: | 0.20 mm |
| Last 7 Days: | 41.60 mm |
| Rain in Apr | 83.60 mm |
|
Apr to Date Avg:10 |
0.00 mm |
|
Apr to Date Diff from Avg:10 |
|
| Avg in Apr | 60.50 mm |
| Diff from Avg: |
|
| Season:1 | 264.8 mm |
|
Avg YTD:11 |
0.00 mm |
|
Diff from Avg YTD:11 |
|
| Last Rain Time/Date: |
25-Apr-2024 at 07:08 |
| 46 rain days in 2024 | |
|
10 days in April 1 day since last rain |
|

|
|
Snow3
| Today: | 0.00 cm |
| Yesterday: | 0.00 cm |
| Snow in Apr: |
|
| Avg in Apr: | 0.00 cm |
| Diff from Avg: | 0.00 cm |
| Season Total:2 | 0.00 cm |
| Snow Depth: | 0.00 cm |
| Share of snow: | 615.00 m |
| 0 snow day in April | |
| 0 snow day in this season2 | |
|
First Snow of Season: ------ |
|
|
Average 1st Snow: 17 of dic |
|
Sunshine
hours Sunlight:
|
|
|
Waning Gibbous |
|

|
|
| Illuminated 95% |
Air
ajax-dashboard6.php - Version 6.95h - 20-Feb-2023 - Script by: Scott of BurnsvilleWeatherLIVE.com
Now supported by Saratoga-weather.org Download
|
Density: 1.25 kg/m3 |
|||
|
Stazioni di rilevamento di Mantova e provincia a cura di ARPA Lombardia |
|||
| Mantova | |||
 |
 |
 |
 |
| Borgofranco sul PO |  |
Sermide |  |
| Magnacavallo |  |
Ostiglia |  |
| Porto Mantovano |  |
Viadana |  |
| Schinevoglia |  |
Monzambano |  |
| Pieve di Coriano |  |
Ponti sul Mincio |  |
| Rodigo |
|||
Heating Degree Days
| Today: | 2.5 |
| Apr: | 117.4 |
| 2024 to Date: | 1081.1 |
| Cooling Degree Days | |
| 2024 to Date: | 5.2 |
Wind Chill
| Current: | 6.2°C |
| Low: | 4.9°C at 06:29 |
| Yesterday: | 4.4°C |
| Record: |
-12.0°C 6-Feb-2012 |
Current UV Index
|
0.0
Sunburn in
720 Minutes |
|
Highest: at 00:00 0.0 |
| Grafico 24 ore | ||
Current Solar Energy9
|
49 W/m2 44% W/m2 ⇒ SI |
|
High Today: at 06:56 49 W/m2 Record: 1296 W/m2 |
| Solar Noon at: 13:15 | ||
| Grafico 24 ore | ||
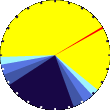
Almanac
| Currently: | Early Morning |
| YTD Avg Temp: | 9.0°C |
| Sunrise: | 06:13 |
| Sunset: | 20:17 |
| Moonrise: | 23:29 |
| Moonset: | 07:01 |
| Full Moon: | 24-Apr-2024 |
| New Moon: |
03:23 UTC 08-May-2024 |
Irrigation Index5
| Updated at Midnight | |
| Current ET: | 0.40 mm |
| 7-Days Rain: | 41.60 mm |
| 7-Days ET: | 17.70 mm |
| 7-Day: |
|
| April: |
|
Station All Time Records
| HIGHS: | LOWS: |
|
37.9°C 22-Jul-2015 |
-9.1°C 6-Feb-2012 |
| Daytime Records | |
|
37.4°C°C
27-Jun-2019 |
-3.0°C°C 09-Dec-2012 |
| Nitetime Records | |
|
30.4°C°C 28-Jun-2019 |
-6.0°C°C 06-Feb-2012 |
|
ICN:19 | S3C2:1 | Ajax 3.08 ISS:Ok | CON:4.2 | RCP:91% |
|
Cloud Level
|
|
| 1 Rain season: Jan 1st to Dec 31st. 2 Snow season July 1st to June 30th. 3 Snow manually measured. 5 Estimated amount of water needed to replace the water used by plants and evaporation from the past week. (Negative numbers mean amount of water needed, positive numbers mean excess water is present.). 9 Solar Index represents either an absolute scale of solar energy (W/m²) using the station’s recorded maximum or a percentage of computed theoretical solar maximum using the station’s location and time of day. These indices differ most when the sun is low on the horizon. The current scale is shown, and will toggle if it or the icon is clicked. . 10 Historical average only to day 26 of just the month of April for this station since 2011. 11 Historical average rain this season to day 26 of April for this station since 2011. |
Now supported by Saratoga-weather.org Download
GLOSSARIO METEOROLOGICO
Indice di calore (Heat Index)
Utilizza la temperatura e l'umidità relativa per determinare la sensazione di calore dell'aria. Quando l'umidità è bassa, la temperatura apparente sarà minore della temperatura dell'aria, dal momento che la traspirazione evapora rapidamente e raffredda il corpo. Quando l'umidità è alta, la temperatura apparente sembrerà più alta dell'attuale temperatura dell'aria, perchè la traspirazione del corpo evapora più lentamente.
|
Top |
Contact Us
Privacy Policy
Cookie Policy
Never base important decisions on this or any weather information obtained from the Internet. The weather data contained herein is offered without any warranties expressed or implied, and is meant to only supplement not replace official weather forecasts and information. MeteoMincio.it © 2010-2024, www.meteomincio.it - Copyright: Commercial use of content is forbidden. Publishing content of this website without the written permission of administrators or owners is forbidden. All trademarks, pictures and logos are the legitimate owners, and are gathered here at no profit. All rights reserved. |